The performance comparison paper
Get the data and scripts to replicate the analysis
Get teh oTree experimental software to replicate the experiment
Comparing input interfaces to elicit belief distributions
by Paolo Crosetto and Thomas De Haan
Aim of the paper
We think that a belief elicitation interface should:
- be easy to understand;
- allow for all sort of beliefs, from simple point estimates to bimodal distributions and more, without imposing any structure;
- manage not to get in the way of subjects;
- help subjects easily express what they believe;
- be fast, responsive, and accurate.
There are several interfaces out there. Which one is the best according to the above criteria? We ran a test to find out.
The test
We test our newly developed Click-and-Drag interface against the state of the art in the experimental economics literature and in the online forecasting industry:
- a text-based interface (try it here)
- multiple sliders (try it here)
- a distribution-manipulation interface similar to the one used at Metaculus (try it here)
We asked 372 MTurkers to mimic a given distribution. It looks like this:
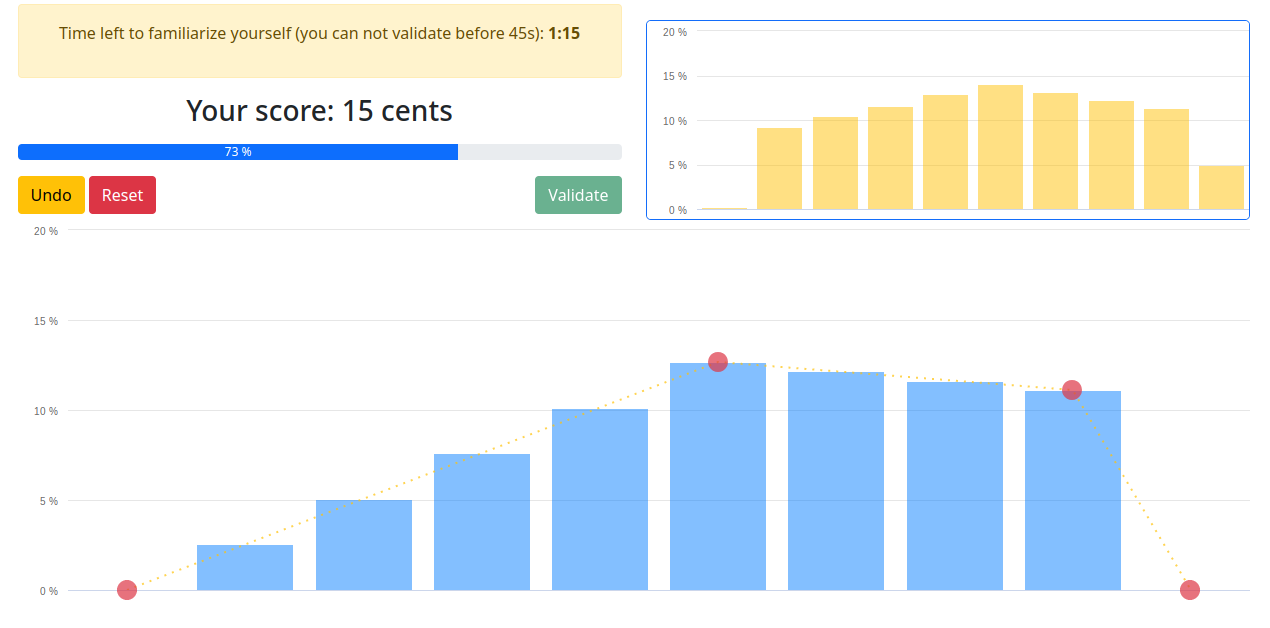
Subjects must simply try to mimic as close as possible the given target distribution. The closer they get, the more they earn.
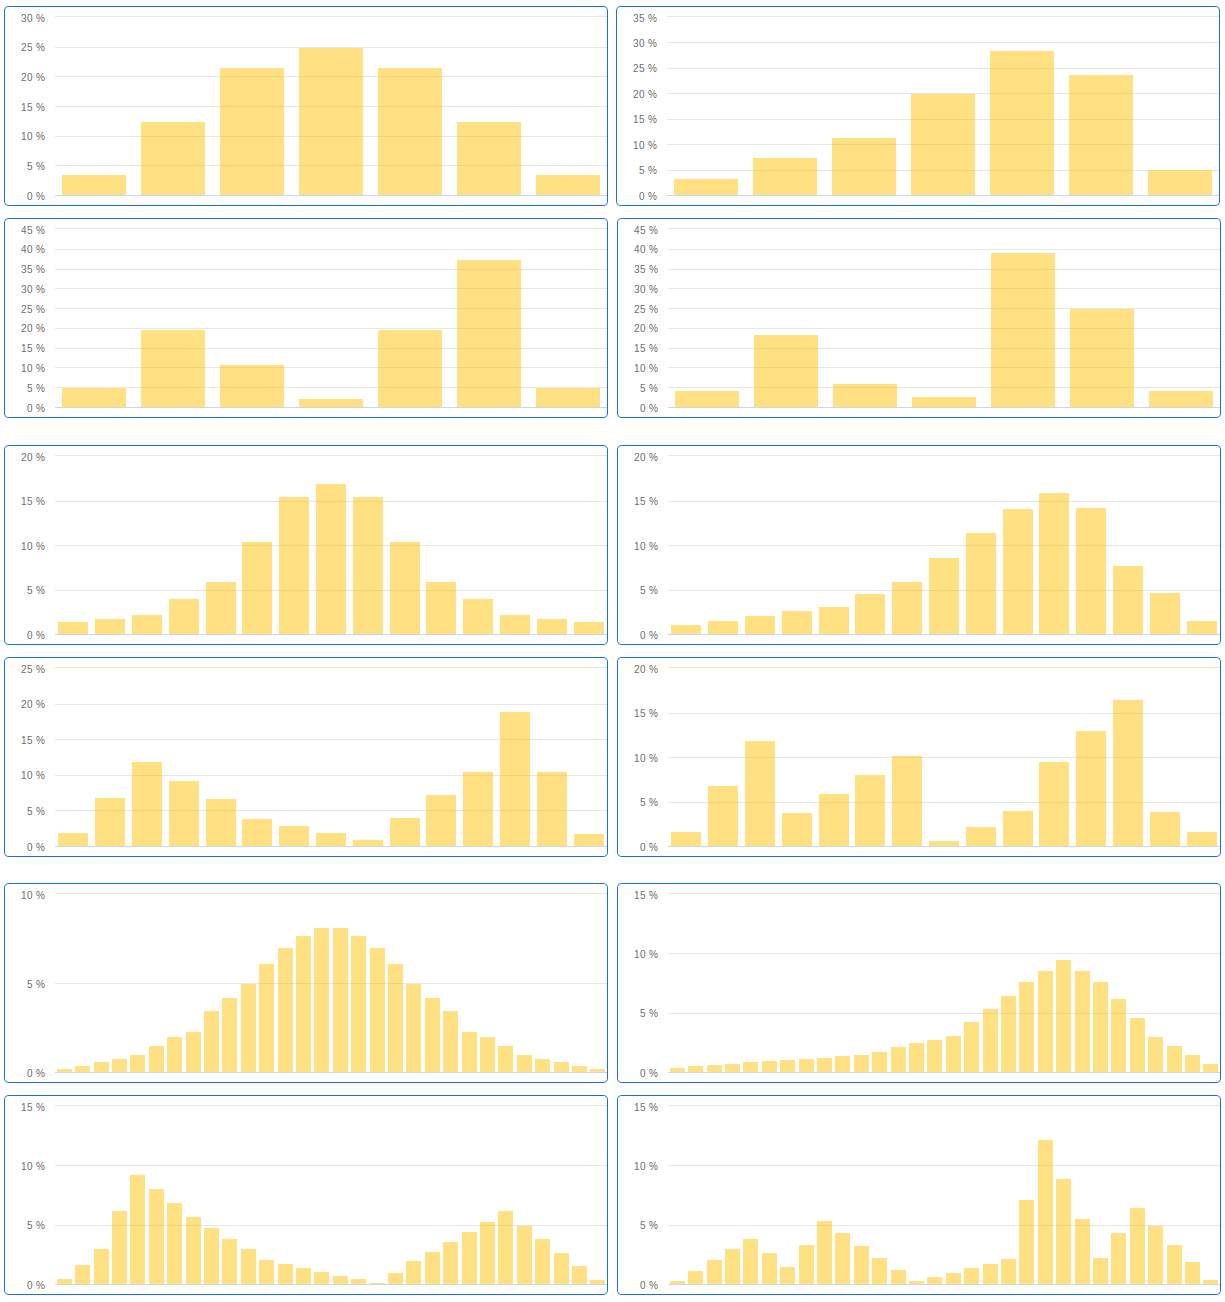
They face screens with symmetric, asymmetric, bimodal, and complex distributions; with 7, 15 or 30 bins; and they are given 45 or 15 seconds per screen. Here are all the screens subjects had to mimic:
We also collect subjective data on ease of use, frustration and understanding.
We pre-registered the experiment (here https://osf.io/ft3s6), with a simple set of hypotheses: Click-and-Drag will outperform all other interfaces.
Sample
We recruit 372 MTurkers – on average middle-aged, mostly male, that on average fare fairly well on our control questions, and who earn between 2 and 3 euros on our 20-minute task:
| Click-and-Drag | 95 | 41% | 36.73 (9.69) | 2.92 (0.75) | 43% |
| Slider | 91 | 42% | 40.56 (10.93) | 2.35 (0.7) | 49% |
| Text | 91 | 48% | 37.07 (10.94) | 2.17 (0.89) | 46% |
| Distribution | 95 | 37% | 37.11 (11.17) | 2.23 (0.43) | 37% |
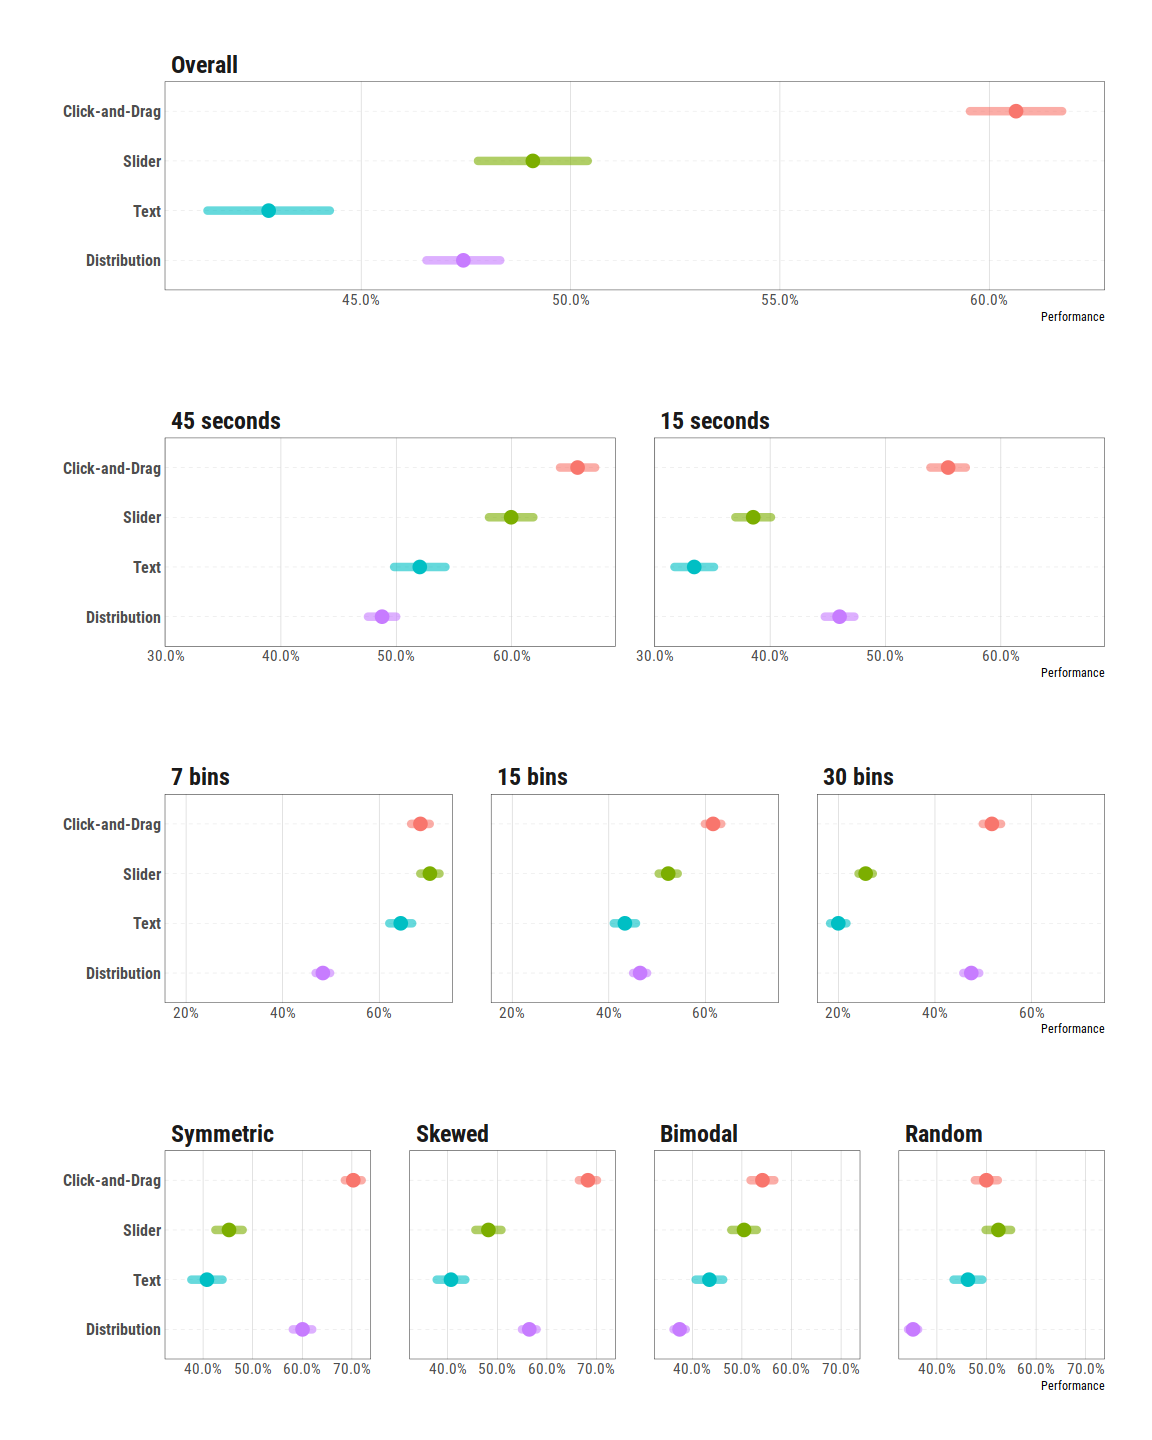
Accuracy
The main indicator is accuracy: how good are subjects at mimicking the target distribution in the allotted time? It turns out Click-and-Drag sports the highest accuracy overall, and when breaking screens down by their type, granularity, and allotted time.
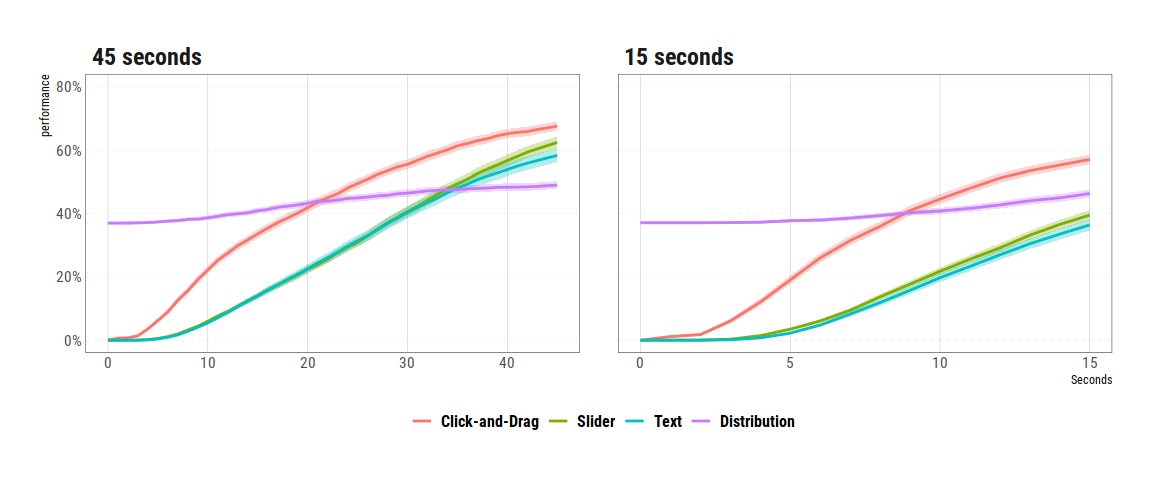
Speed
An interface is good if it allows for a good accuracy, but also if it does so in a limited amount of time. Is it easy to draw the main strokes of one’s beliefs or is it a long and painful exercise? How fast do subjects converge to the best accuracy?
It turns out Click-and-Drag allows for a faster convergence than all other shapes. In this plot we draw accuracy at each point in time for each belief elicitation interface. Distribution starts with an unfair advantage, as it does not start with a blank sheet but with a normal-looking distribution; still, its slope – the speed of convergnece – is the lowest of them all.
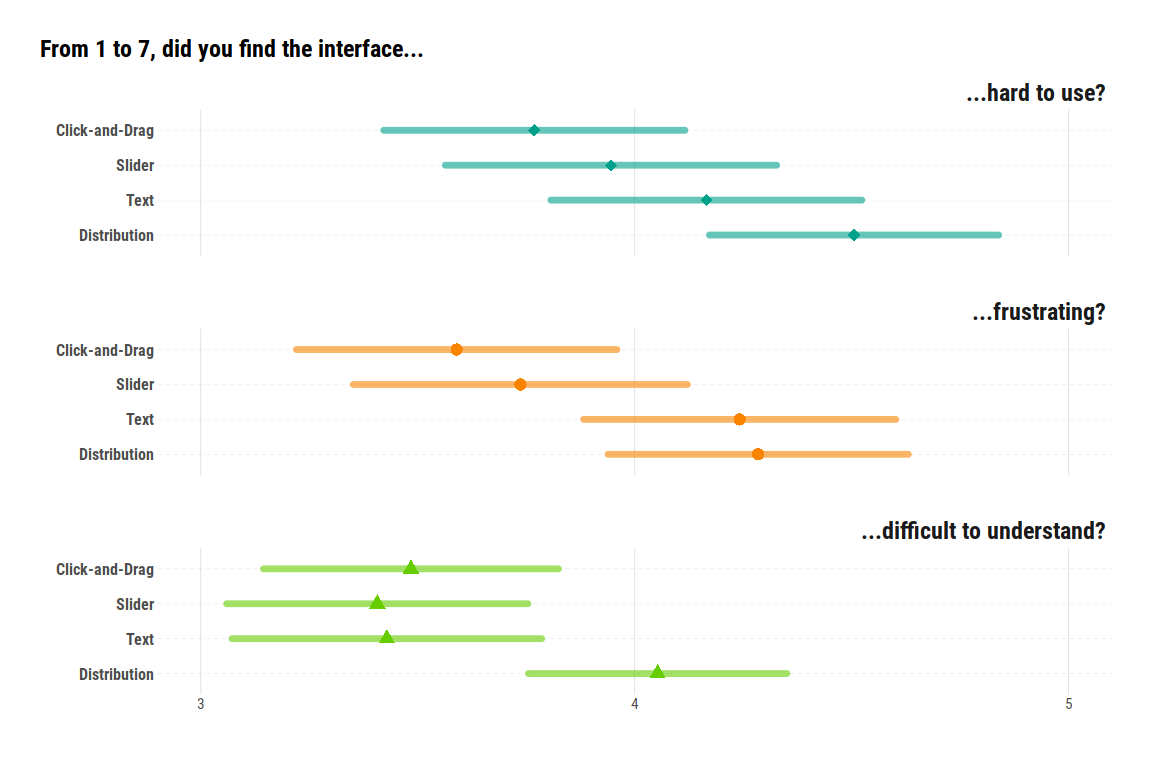
Self-reported assessment
But how do subjects themselves rate the interfaces? We asked three questions about the ease of understanding, ease of use, and generated frustration.
Click-and-Drag comes on top of all self-reported assessment (even if most of the differences are not significant).
Get the paper
You can find the paper, with all the details, more results, statistical tests, and further exploration of the interfaces’ performance here
Get the software
Find the oTree code for each of the four interfaces here
Try it out yourself on our oTree demo here
Comments? Questions on how to implement this for your own experiment? Contact us!